US Population and Agricultural Trends
Recently, while looking through datasets I stumbled upon an interesting and somewhat shocking bit of information. Since 1960 the population of the U.S. has increased from around 179 million to around 330 million people. However, in this same span of time the amount of agricultural land in the U.S. has dropped from around 450 million hectares (a measure equaling 100 square meters) to 405 million hectares. (Fun fact, this difference of 45million hectares is almost exactly the size of Sweden!)
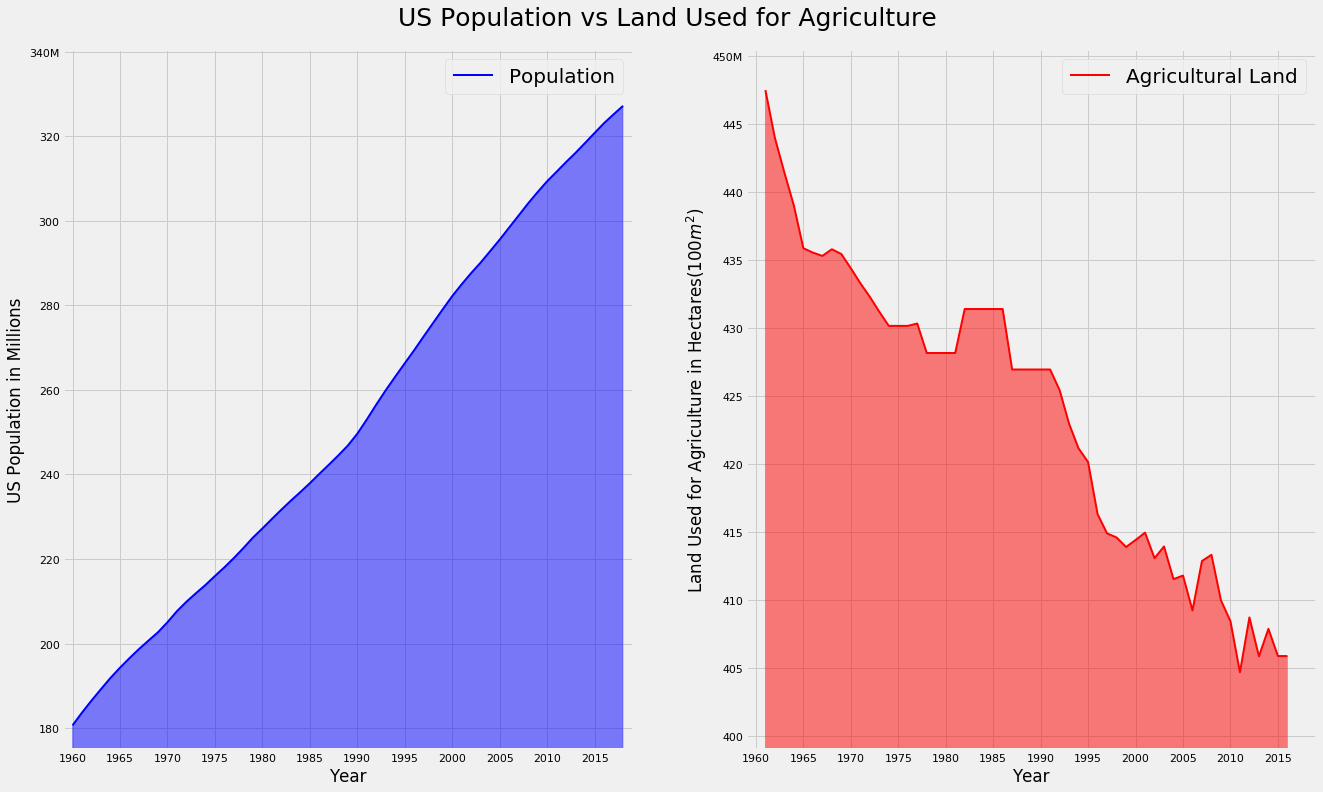
Data gathered from the Food and Agriculture Organization of the United Nations
At first glance this may not seem like much, only around a 10% decrease over 50-60 years. Yet, when taking into account that the population has increased by nearly 85% in that same timeframe, you may ask (as I did) “How are we feeding everyone!?” I decided to do some investigating to try to shed some light on this.
So, what is really going on here?
First, let’s take a look at how much we import per year for some of the most widely consumed items in the US:
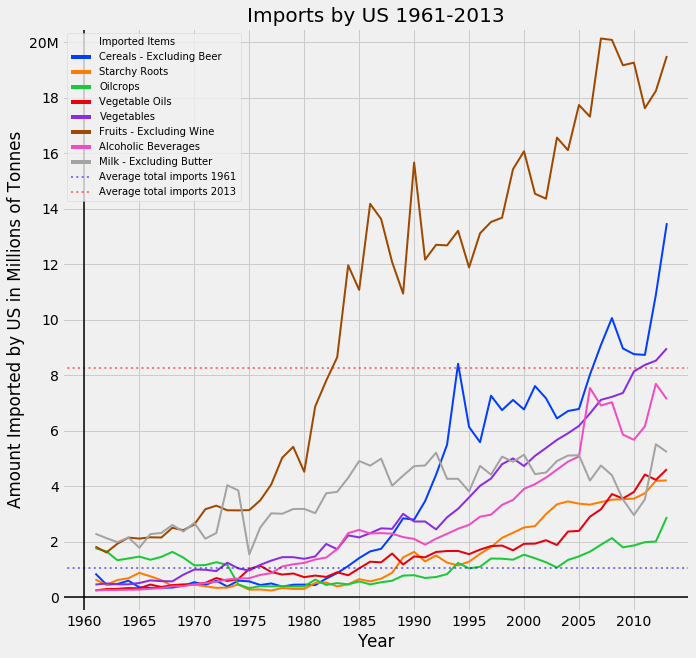
Data gathered from the Food and Agriculture Organization of the United Nations
As we can see, over the last 40 years the amount of food that we import has skyrocketed. Even if we exclude fruits from this list, which climbed from around 2million tonnes per year to an astronomical 19million tonnes (that’s around 42 BILLION pounds), we can see that almost every other item at least doubled in amount over this time period as well. This may suggest, perhaps, that the amount of farmland is decreasing due to lack of necessity. With so much more being imported, maybe there isn’t enough of a market to support so much farmland.
Maybe there just isn’t as much desire for farmland?
To check this theory, I looked into the average cost per acre of farmland:
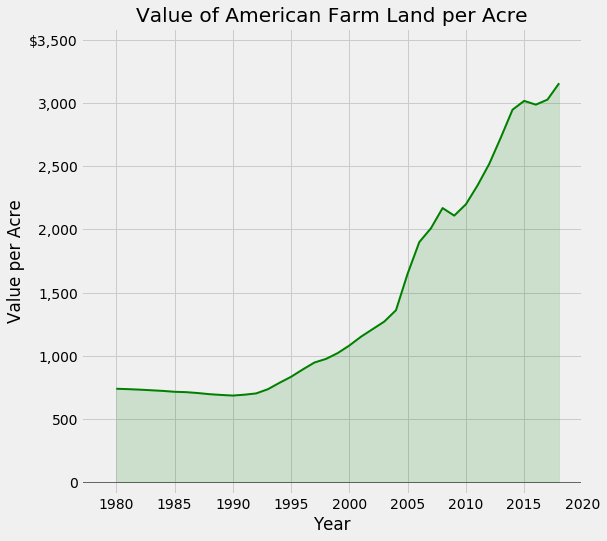
Data gathered from the Food and Agriculture Organization of the United Nations
What I found was that the cost of farmland in the US increased sharply as the years passed. There are a multitude of factors affecting the value of any land in the US, but I believe one large contributor is the consolidation of the agriculture business as a whole. For the purposes of this study I didn’t want to go too deep into agricultural economics (you could spend hours and hours researching and looking into the changes over the last 50 years and only skim the surface of the subject!). With smaller farms starting to disappear and huge agricultural conglomerates (Monsanto, ADM, Cargill alone hold a large percent of the market) taking over, the question of price becomes less interesting and the questions of how and what are we farming become more intriguing. To answer these questions, I decided to follow them up with a look into American dietary changes.
How eating habits have changed over the last 60 years
I created this graph to demonstrate clearly where the American diet has diverged and in what ways it has stayed relatively constant:
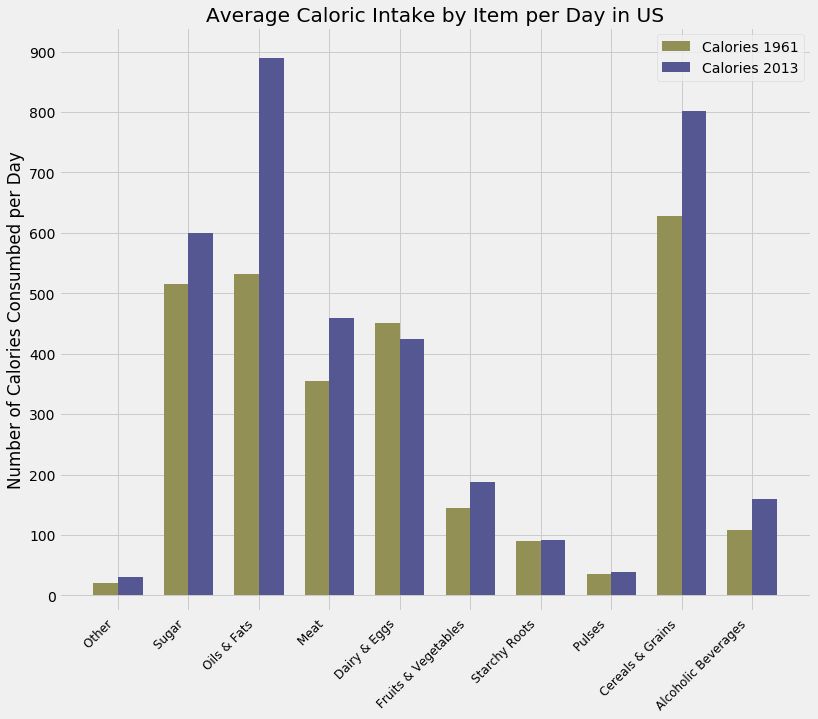 Data gathered from the United States Department of Agriculture Economic Research Service
It is clear that while Americans are consuming more of every group besides dairy and eggs, we are consuming oils & fats, meats, sugars, and cereals & grains at vastly greater rates than in the past. With many of these items being mostly sourced in the US, I wondered again: “how are we supporting this vast difference”? I decided to next look at how much we are producing as a nation. While it is true the production numbers have improved drastically since the 1960’s, I think it is more telling to look at how much yield we are getting from our farmland rather than a gross total.
Are we getting more out of the land?
To answer this question I decided to look at the yields of some of our most popular and most consumed items, beef and poultry, and aggregates of vegetables and fruits respectively.
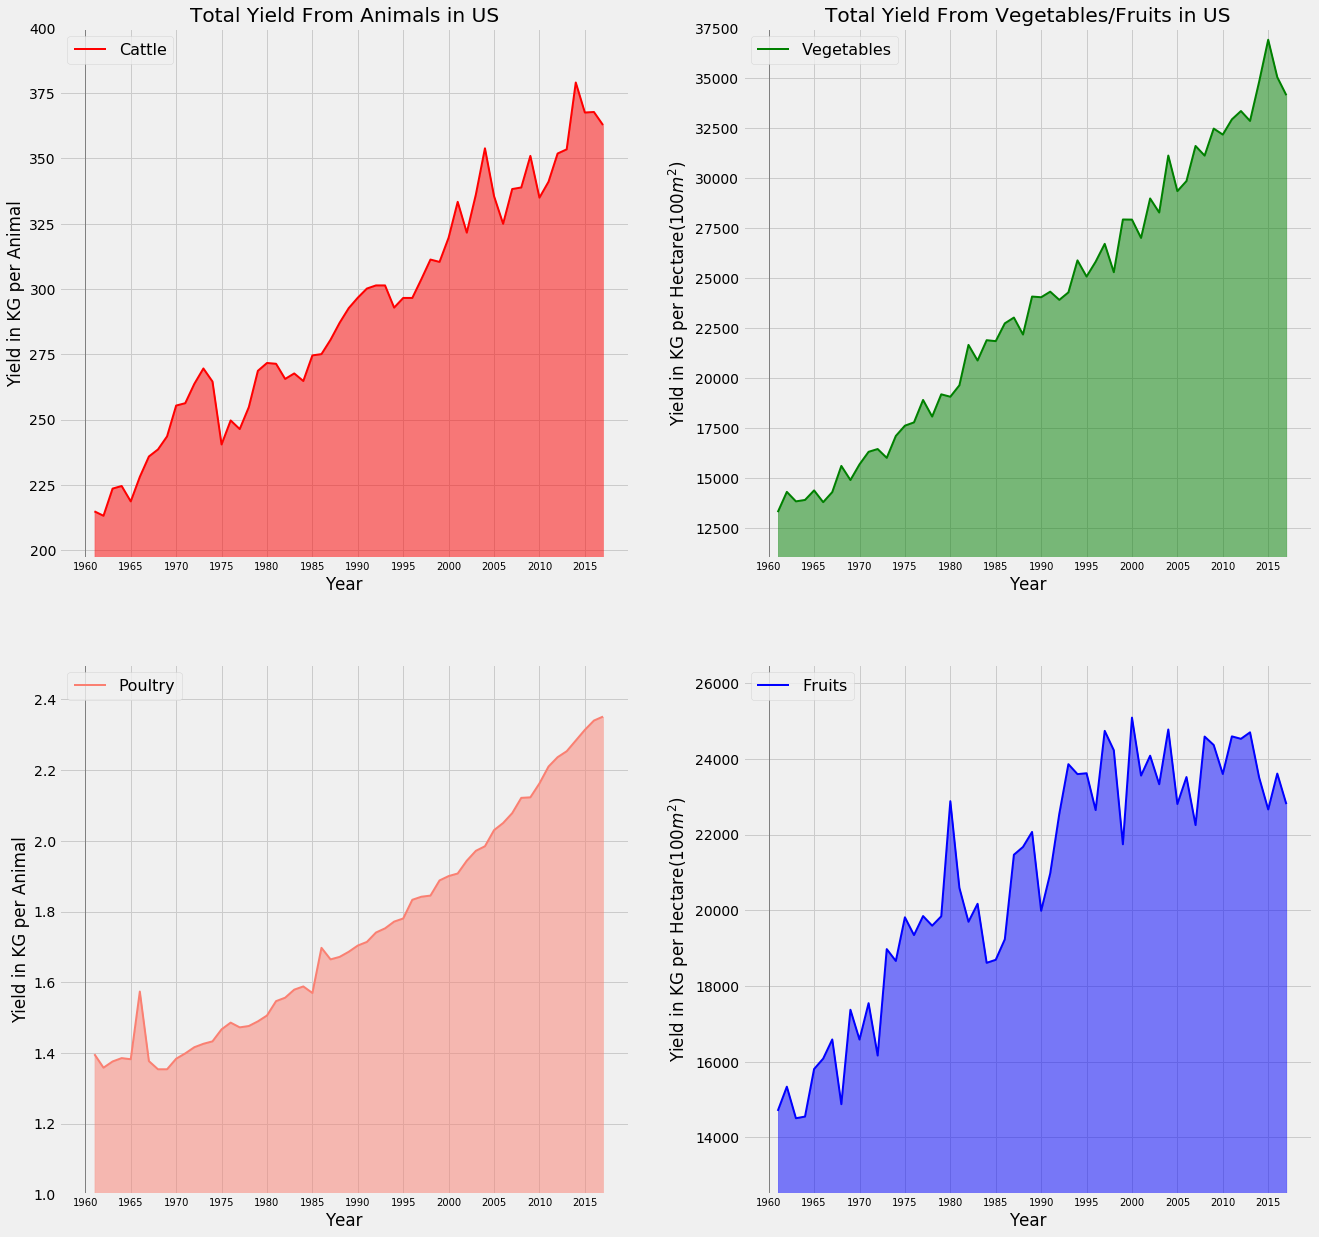 Data gathered from the Food and Agriculture Organization of the United Nations
These numbers really made my jaw drop, with some more than doubling since the 1960’s. We can see that there has clearly been great progress in the industry over the time frame, and that with these advancements the nature of the industry itself may be changing. Since the 1950’s the FDA has approved multiple steroid hormone drugs for use with cattle and poultry that increase not only the animals’ growth rates but also the rate at which they can convert what they eat into meat. During this same time frame there has been an explosion of advancements in genetically engineered (GE) crops as well.
Genetically Engineered crops take over
To explore this idea further, I looked at three of the most grown crops in the US and compared the amounts of crops planted that were GE to the number of non-GE crops.
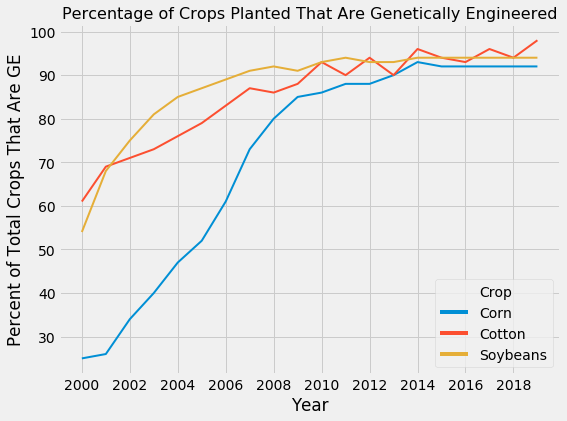
Data gathered from the United States Department of Agriculture Economic Research Service
As you can see, in only the last 20 years these three crops have become almost exclusively GE. GE crops consist of any crops that have had their DNA changed by using genes from other plants or animals. For example, non-GE tomatoes tend to have very soft skin making them prone to being crushed both in the fields and especially in transit. As such, many strains of tomatoes in the US have been modified to increase the thickness of their skin, greatly increasing the yield as well as ease of transportation. There are still many non-GE strains of produce; however, the vast majority of planted crops in the US today are GE. Whether you support or oppose the use of GE it has quickly become the standard and is, perhaps, the only sustainable model for the future.
Cause for Concern or Sign of Progress?
In the end I believe the drop in total farm area is heavily influenced by the factors I’ve outlined above. With smaller farms being bought out by big conglomerates and a higher yield from every crop planted or animal raised, there is less area needed to produce even more. The items that give the greatest yields are the crops that we’ve focused on producing most heavily, and we’ve made up the difference in other items with imports. This, however, leads to many more questions. Is this a sustainable model? Are we supporting monopolization of an industry simply by consuming foods? Is it morally acceptable that at the current pace our grandchildren may never even taste non-GE food? I’d love to say that I have all the answers, but in truth, I don’t believe anyone does yet. It seems clear, however, that we need to find a path to sustainability and although we have made progress towards it we have a long road ahead of us.
Notebooks used for data can be found here Check this post out on medium